Skip to content

3D Data Lab

Physical data sculptures and 3D data models for research and academic work

Your data, visual and in your hands.

CC5CC1CC2CC4CC3M1M2M3CK3CK4CK2CK1SK3SK4SK2SK1SC4SC1SC3SC2P1P2P3P4
x · y · z
Systematic evidence map, 2005–2025 · 712 records, 47 studies
  • 47 studies
  • 20 mechanisms
  • 74 threads

Journal covers, Conference talks, Thesis defenses, Graphical abstracts, Figures for papers, Grant proposals, Poster sessions, Lab outreach, Museum demos, Supplementary material, Peer review

02 / Protocol

The protocol

Four steps from your data to a finished model, plus an optional print.

  1. 01

    Brief

    You send the data and tell us what the figure needs to show.

    Deliverables

    • Data review and a short call or email exchange about your goals
  2. 02

    Concept

    We propose a form and a color mapping.

    Deliverables

    • Proposed form and color mapping
  3. 03

    Modeling

    We build the model and render it.

    Deliverables

    • High-resolution renders (PNG)
  4. 04

    Delivery

    You receive the files and renders, ready to use.

    Deliverables

    • STL and 3MF files
    • A short note on the data-to-geometry mapping
  5. 05Optional

    3D Printing

    Want to hold it? Add a full-color Bambu Lab print with the Modeling + 3D Print package.

    Deliverables

    • A full-color printed data sculpture
    See Modeling + 3D Print

How it works

For Nerd Fun

When the paper is submitted, our side lab wakes up: nerdy personal and company data, no peer review required.

Ring of twelve standing books of different sizes around a pair of reading glasses, with covers in red, green, blue and mustard by kind of book.
AI concept image

A reading year, one book per month

Each book is one month of reading, standing in a ring around your reading glasses. The bigger the book, the more pages; the cover color is the kind of book.

Pages per month

NovelsEssaysScienceClassics

↳ Example data: 3,802 pages in the year, about 317 a month.

Smiling fluffy white dog figurine sitting at the center of a round base, surrounded by a ring of twelve columns, one per month of park visits: low and green in autumn and winter, tall and orange in spring and summer.
AI concept image

A year of park visits, around your dog

Each column is one month of walks to the park, standing in a ring around a figurine of your dog. Taller means more visits: spring and summer in orange, autumn and winter in green.

Visits per month

Mar to Aug: spring and summerSep to Feb: autumn and winter

↳ Example data: 178 visits in the year, about three in four between March and August.

Flat world map with eight columns standing on cities, taller where more nights were spent, colored red for the Americas, blue for Europe, green for Africa and yellow for Asia.
AI concept image

A year of trips, in nights away

Each column stands on a city of the map and its height is the nights you slept there. The color is the region of the world.

Nights per city

AmericasEuropeAfricaAsia

↳ Example data: 109 nights in 8 cities, more than a quarter of them in Buenos Aires.

Long skyline of buildings, one per week of walking, in navy, teal and light blue, crossed by a lime rail at the 10,000 steps goal.
AI concept image

A year of steps, as a skyline

Each building is one week of walking and the lime rail marks your goal of 10,000 steps a day. The chart averages the weeks by month: navy above the goal, teal close to it, light blue well under.

Average steps per day, by month

10,000 or more8,000 to 9,999Under 8,000Goal: 10,000

↳ Example data: 4 of 12 months above the 10,000 steps goal.

Wide calendar of 365 small columns, one per day, in purple for strength, teal for cardio, orange for yoga and grey for rest.
AI concept image

A year at the gym, one column a day

Each column is one day of the year: strength, cardio, yoga, or rest in grey. The chart counts how many days of each kind.

Days per type

StrengthCardioYogaRest

↳ Example data: 365 days, 186 active and 179 rest.

Staircase of twelve blocks rising from left to right, the first six in light teal and the last six in deep blue, with the tallest step in December.
AI concept image

A year of growth, one step at a time

Each block is one month and the climb is the number of users. The first half of the year in light teal, the second half in deep blue, with the biggest jump in December.

Users per month

Jan to Jun: first halfJul to Dec: second half

↳ Example data: from 120 in January to 4,800 in December, 40 times more.

1 / 6

Peek at For Nerd Fun

04 / Questions

Frequently asked questions

Read the full FAQ

What data formats do you accept?

CSV, XLSX and JSON work best. You can also send a plain description of what you want to show and we will help you shape the data.

What does “2 iteration rounds” mean?

In the Modeling + 3D Print package you review our renders twice and we apply your feedback each time before we print. Extra rounds can be quoted if you need them.

How does quoting work?

Send a quote request or an order with your data and goals. We review it and email you a price. Nothing starts until you approve it.

How long does a project take?

It depends on the complexity of the data and the print size. We confirm the timeline in your quote, so tell us your deadline up front.

Do you ship, and how much does it cost?

Yes, we pack and ship printed pieces. Shipping options and cost depend on the destination and size, and we confirm them in your quote.

What do you need for a print-only order?

A 3D file in STL or 3MF format, plus your size, color and quantity preferences. We check printability before we print.

Can I use the renders in my paper?

Yes. The renders we deliver are made for your figures, covers and slides. Check your journal's own figure guidelines for format details.

What is For Nerd Fun (FNF)?

FNF is our playful line of personal and company data sculptures, like a family tree, a gym year or a hiring funnel. It works with any of the three packages.

Your next sculpture

Let’s chat about your data

Book 15 minutes with me to talk about your article, your data or an idea you’d love to turn into a sculpture.

Sathya Mariana Llull

Meet me on LinkedIn

Free tool

Turn your data into a 3D sculpture

Solo or with a team: turn a milestone into a 3D printable sculpture and a LinkedIn-ready card in seconds.

Build my sculpture
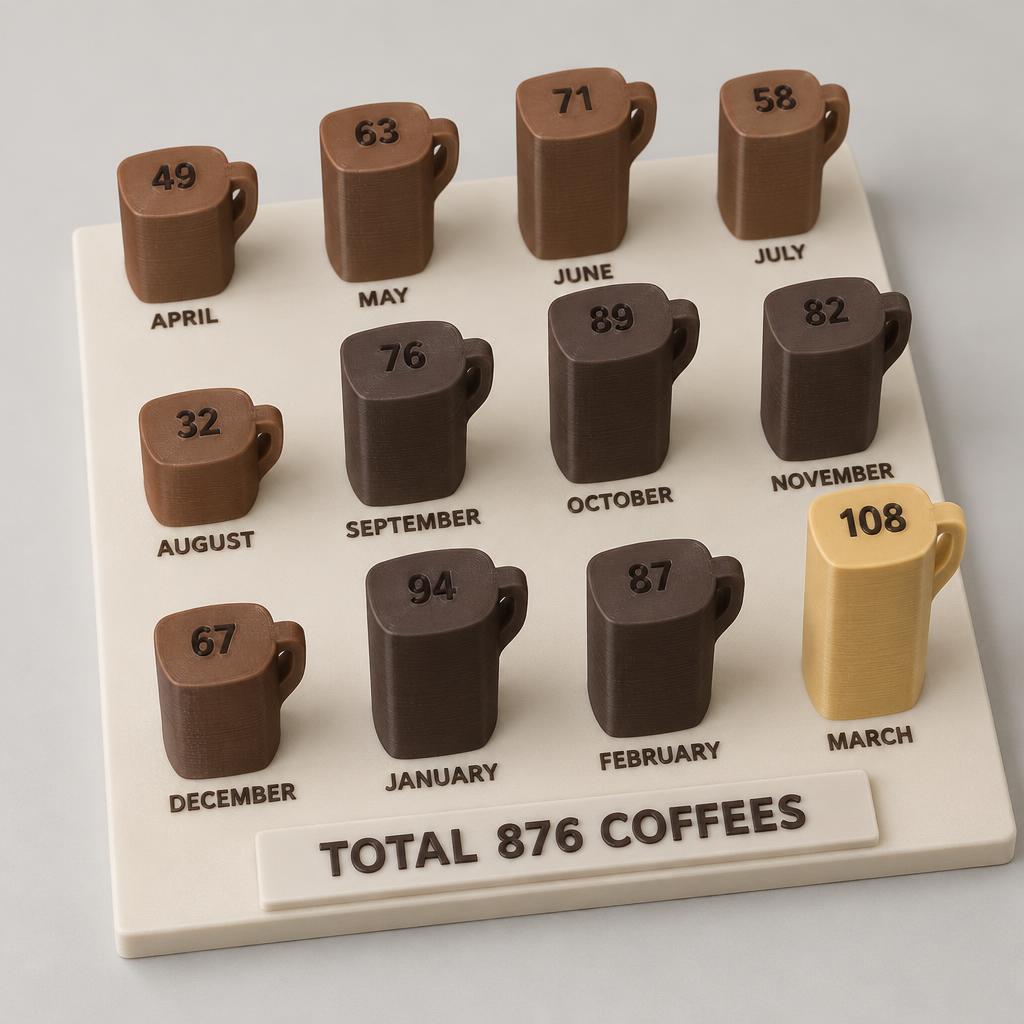
AI render of a data sculpture: Total Coffes in the last 12 months

AI concept image

Made with the Free Lab

Total Coffes in the last 12 months

COFFEES

Total
876
Minimum
32
Maximum
108

What it represents

Base
Months, April through the following March
Height
Column height is proportional to the number of coffees.
Color
Medium roast brown for lower values, dark espresso brown for higher values, and pale golden-yellow crema for the maximum.
  • Used the last 12 monthly values, from April through the following March.
  • The coffee theme follows your idea; the pasted header was ignored.

Illustrative AI render based on the numbers sent to the Free Lab. Our lab refines the sculpture before printing.

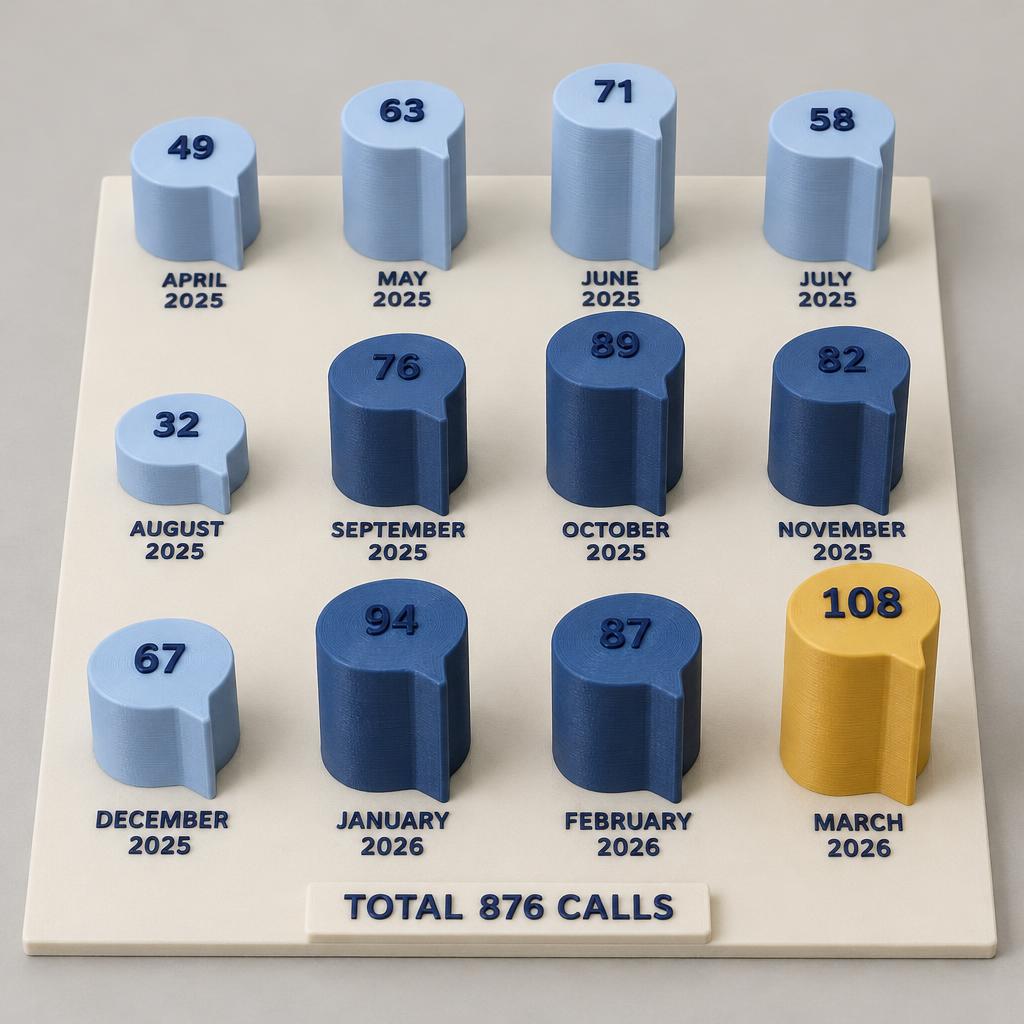
AI render of a data sculpture: Discovery calls in the last 12 months

AI concept image

Made with the Free Lab

Discovery calls in the last 12 months

CALLS

Total
876
Minimum
32
Maximum
108

What it represents

Base
Month, in chronological order
Height
Column height is strictly proportional to discovery calls.
Color
Light blue for the lower six values, midnight navy for higher values, and warm amber for the maximum.
  • The header and first three values were excluded, retaining the final 12 monthly values.
  • No years were supplied. The period labels provisionally use April 2025 through March 2026, the most recent completed April-to-March span. Confirm these years before printing.

Illustrative AI render based on the numbers sent to the Free Lab. Our lab refines the sculpture before printing.

1 / 2

Priced by quoteRequest a quote